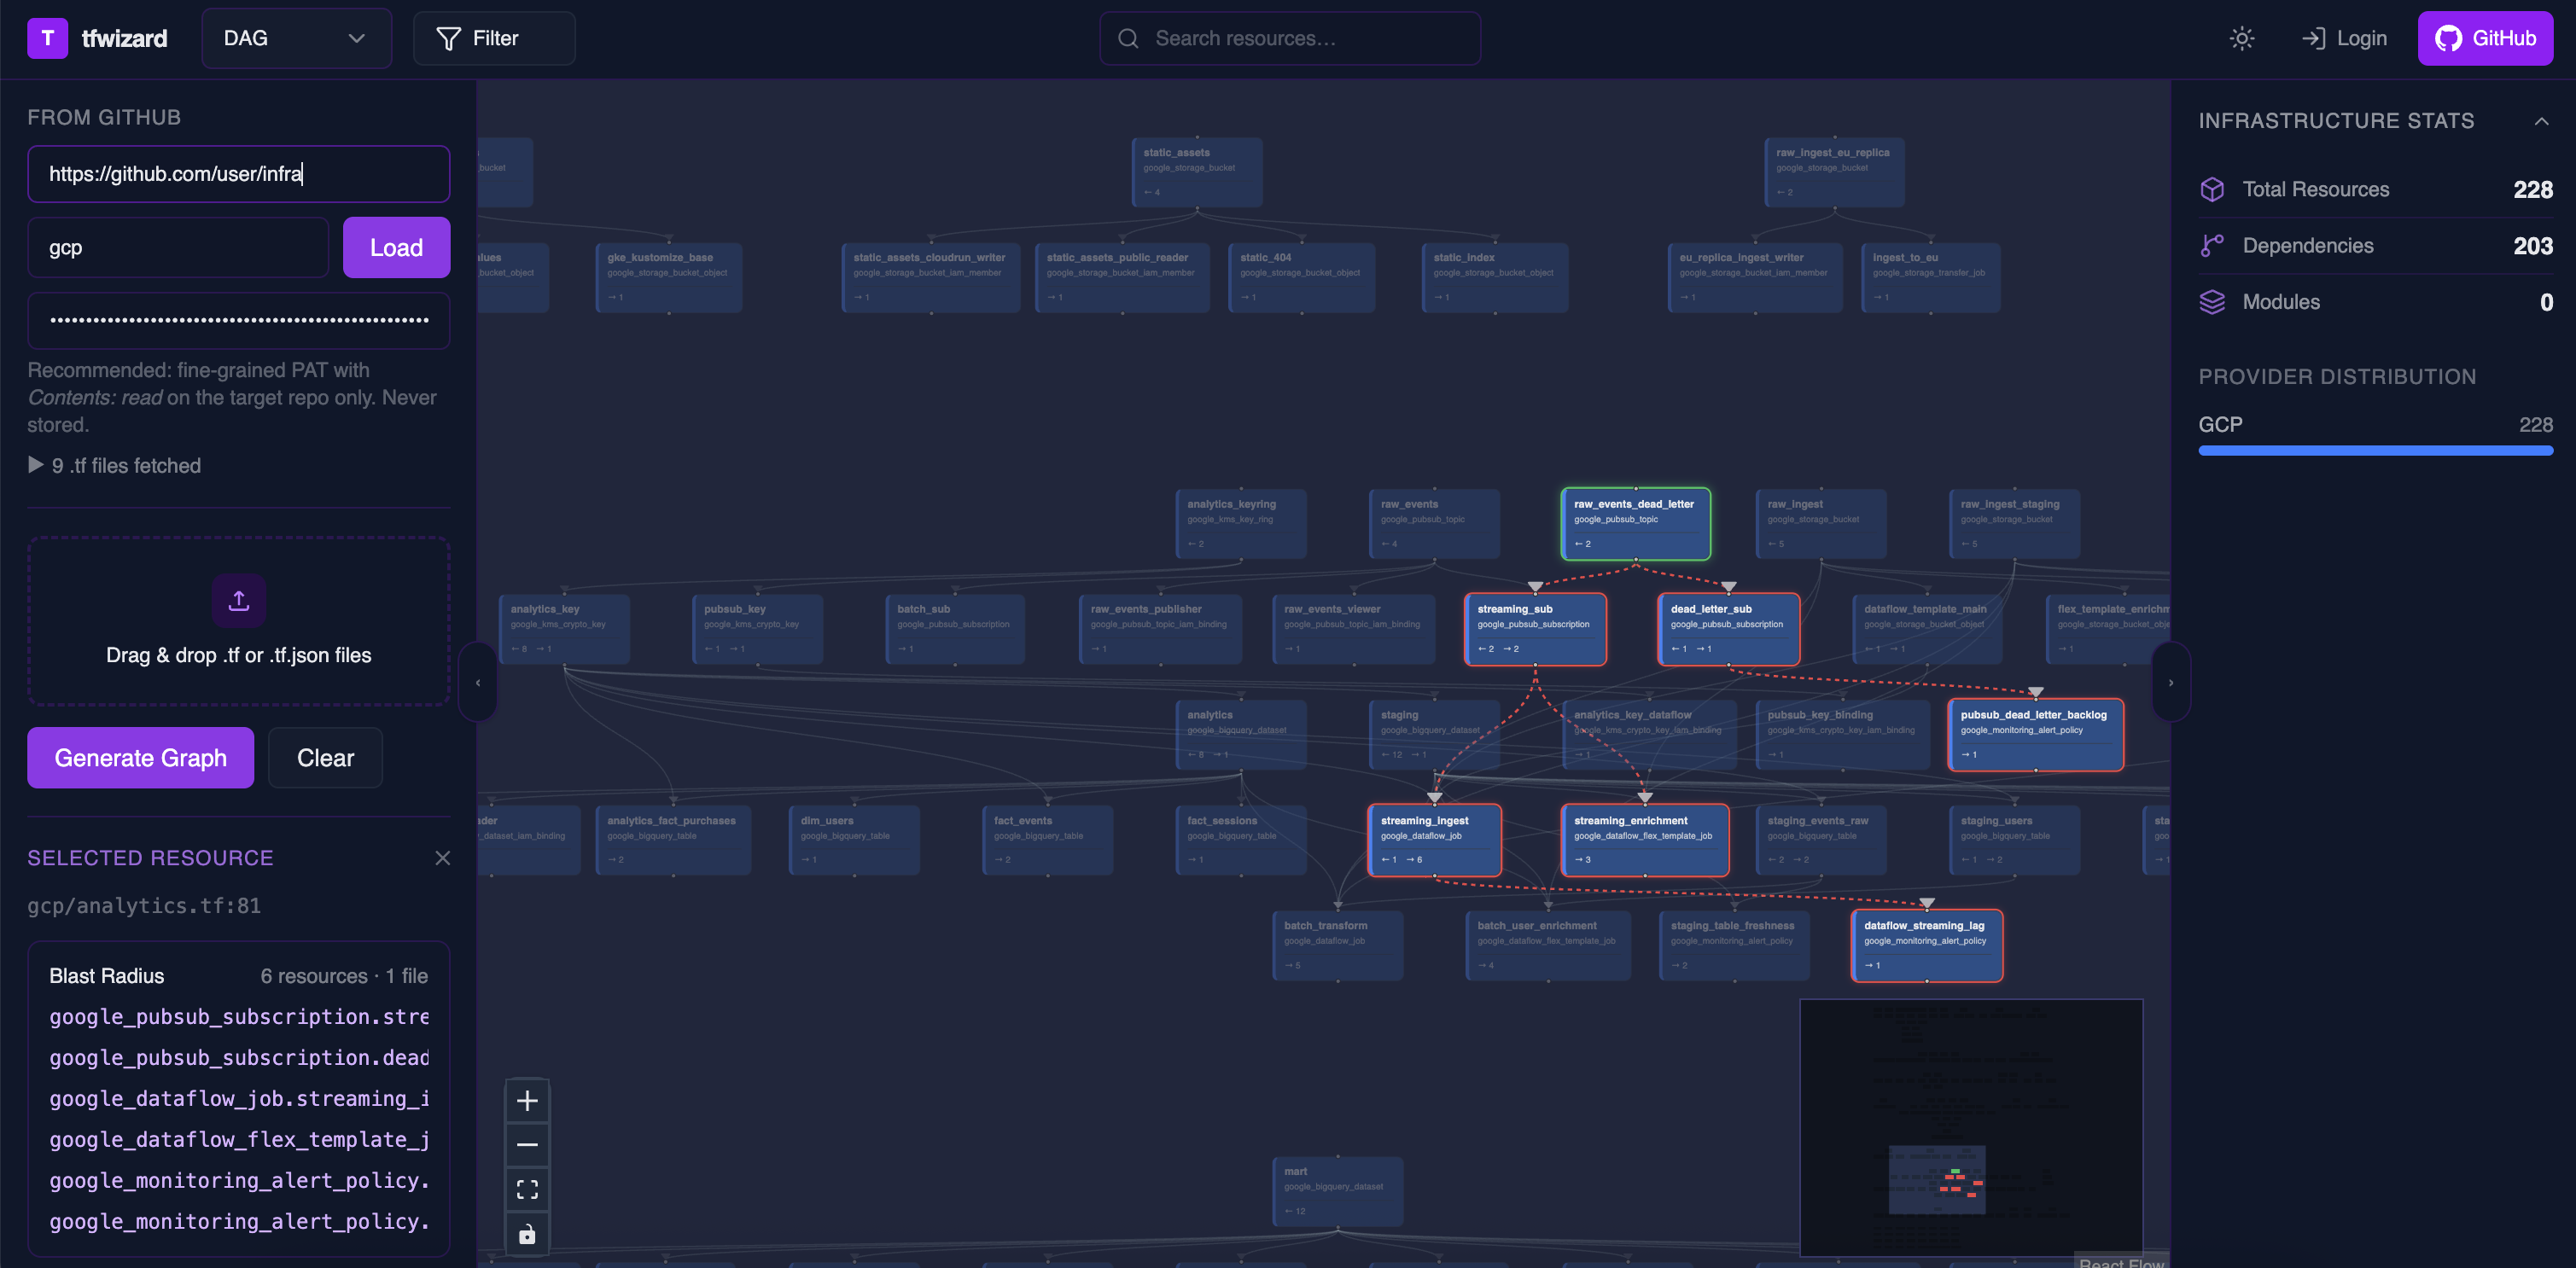
Load any Terraform repo from GitHub and explore an interactive graph
of its resources, modules, and dependencies.
No cloud credentials. No terraform init. No state files.
Everything in the browser, nothing to install.
Click any resource to highlight everything it affects transitively — useful when planning a change.
Expand module nodes to see their internal resources inline. Collapse them to keep the view manageable.
Paste any GitHub URL — public or private. Supports monorepos and multi-module layouts.
Filter the graph to matching resources in real time — useful in large codebases.
Highlight by category — compute, networking, storage, IAM, AI, and more — across AWS, GCP, and Azure.
DAG for hierarchical depth-based views; radial for a component-centric overview. Switch any time.
terraform graph generates a raw DOT representation of Terraform's dependency graph and requires Terraform CLI. Other visualization tools typically require a state file to generate a graph.
tfwizard instead parses the source files directly, so you can explore a repository without initializing Terraform, downloading providers,
or having access to its state. It also provides an interactive UI with module hierarchy, resource search, filtering, and blast-radius analysis
.tf files are stored in your own browser's local storage
and sent to the server for parsing. The server holds only the parsed result in memory — no raw file bytes
— and that in-memory state can be lost if the server scales down between requests.
password, secret,
token, api_key, and similar — are replaced with [redacted] in the graph.
This matters most for the GitHub path; for manual uploads your browser already holds the original files.
.tf files directly. Nothing to install or configure.Load from GitHub or upload .tf files directly. No installation required.